What is the rate of Ice melt?
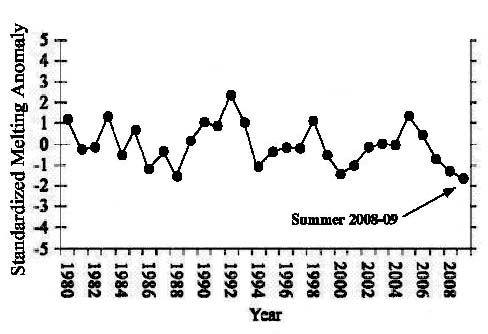
World Climate Report posted the following line graph to illustrate the Antarctic snow melt index (October-January) from 1980-2009:
The report included a list of NASA stories that highlight record high amounts of ice melting across Greenland. In recent years, NASA has written extensively on increasing snow melt and published findings by scientist Marco Tedesco.
A May 2007 NASA report declared, "In 2006, Greenland experienced more days of melting snow and at higher altitudes than average over the past 18 years, according to a new NASA-funded project using satellite observations."
On Sept. 25, 2007, NASA reported once again that Greenland snow melt hit record highs.
NASA also reported extensive snowmelt in Antarctica in 2007 and 2008.
"On the world's coldest continent of Antarctica, the landscape is so vast and varied that only satellites can fully capture the extent of changes in the snow melting across its valleys, mountains, glaciers and ice shelves," NASA reported. "In a new NASA study, researchers using 20 years of data from space-based sensors have confirmed that Antarctic snow is melting farther inland from the coast over time, melting at higher altitudes than ever and increasingly melting on Antarctica's largest ice shelf."
NASA warns that "Antarctica contains 90 percent of Earth's fresh water, making it the largest potential source of sea level rise."
In March 2008, NASA reported the Wilkins Ice Shelf on the Antarctic Peninsula disintegrated, something it said was "an indication of warming temperatures in the region."
Check
Yojiro
