Is possible to explore other profit sources?
Industry Profit analysis
The television network market consists of advertiser spending on broadcast and cable networks plus other sources of revenue that vary by region. In North America, the television network market comprises license fees paid by cable systems and satellite providers to basic and premium cable networks. In Europe, Middle East, Africa (EMEA), and Asia/ Pacific, it includes public TV license fees. Net advertising figures—made up of spending minus agency commissions and discounts—are tracked in EMEA, Asia/Pacific, Latin America, and Canada. Advertising in the United States is customarily reported with agency commissions included.
I would like to give a little insight of the recent years profit situation of TV industry through some data of Australia, EU and US market.
Australia
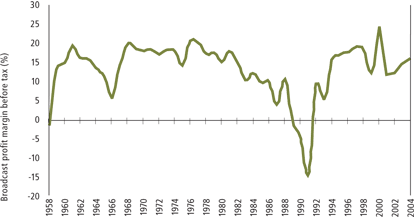
The many ownership changes that occurred in the commercial television ector between the mid 1980s and the early 1990s caused abnormal losses during the period. However, the sector had returned to healthy levels of profitability by the end of that decade. In fiscal 2001 and 2002, profit margins were reduced due to an unexpected decline in advertising revenue in calendar 2001. 2004 saw a modest rise in revenues, profit and margins. We can see more from the picture below
Broadcast profit margin before tax of Australian commercial television stations 1958-2004

Data is collected from Australian Film Commission
EU
The meeting of experts on the reform of the instruments to encourage the European audiovisual industry addressed a profound research of financial situation in EU TV market.
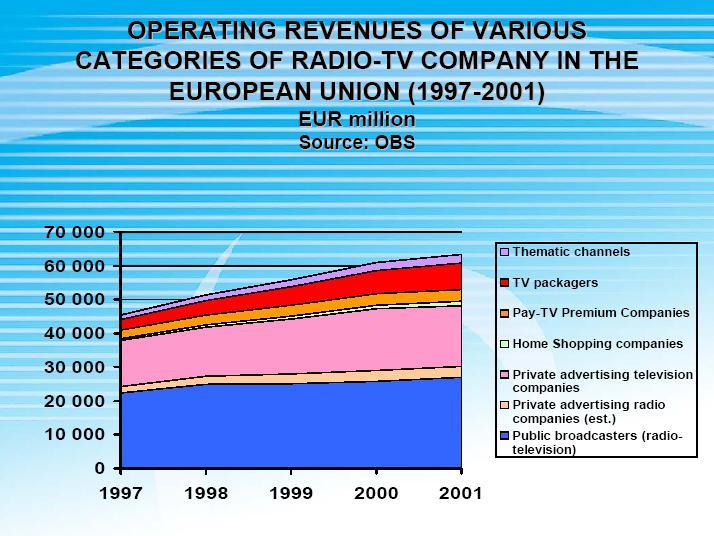
Operating Revenues of various categories of radio TV company in the European Union

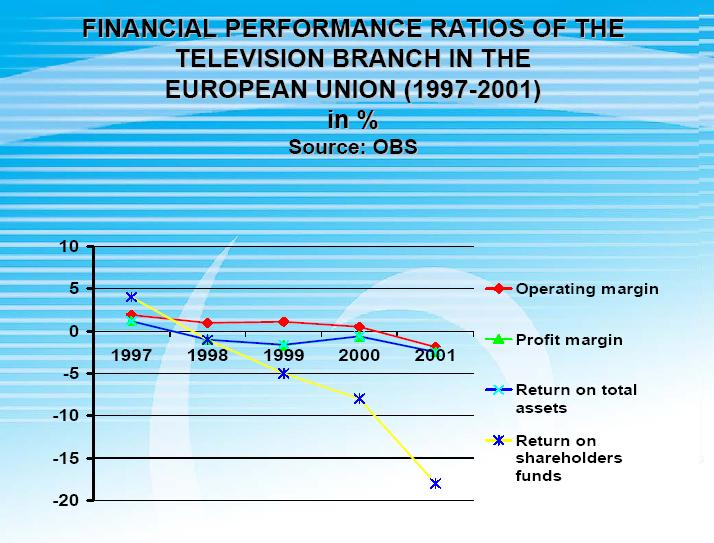
Financial Performance Ratios of the Television Branch in the European Union 1997-2001

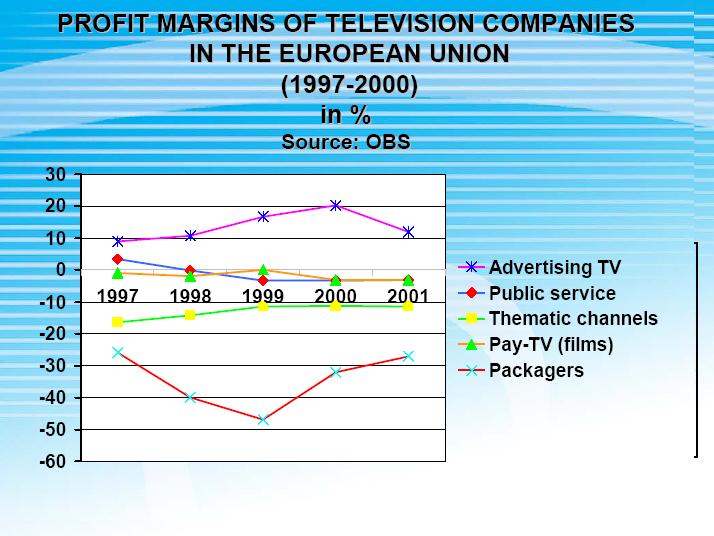
Profit Margins of Television Companies in the European Union

We can see here that even though the operating revenues were steadly increasing during the past few years, the important ratios were not optimistic enough at the same time. What was consistent in all the years was advertising's strong position of creating profits.
Data is collected from Meeting of Experts on the Reform of the Instruments to Encourage the European Audiovisual Industry. http://www.obs.coe.int
US
The PricewaterhouseCoopers business firm's Global Entertainment and Media Outlook: 2004-2008 report predicts that by 2008, the industry will reach $174 billion. The fastest growing market is, not surprisingly, the United States with an annual growth rate of 7.5%.
US's is composed of big four in Broadcast and big three in Cable
Big Four in Broadcast
CBS Television Network
2004 Revenue: $7.76 billion
Number of owned stations: 39
Number of affiliates: 200
NBC Television Network
2003 Revenue: $6.87 billion
Number of owned stations: 29
Number of affiliates: 230
Fox Broadcasting Company
2004 Revenue: $4.55 billion
Number of stations owned: 35
Number of affiliates: 200
ABC Inc.
2004 Revenue: $11.78 billion
Number of stations owned: 10
Number of affiliates: 225
Big Three in cable
QVC Inc.
2003 Revenue: $4.9 billion
Households reached: 86 million in the U.S.A., 13.1 million in the United Kingdom,
34 million in Germany, and 11.6 million in Japan.
ESPN Inc.
2004 Revenue: $3.2 billion
Corporate Owners: Walt Disney Co. owns 80% and The Hearst Corporation owns
20%.
Home Box Office Inc. (HBO) & Time Warner
2004 Revenue: $3 billion & 2004 Revenue: $42 billion
Data is collected from
http://www.turnoffyourtv.com/networks/revenueupdate04/revenue.html
Advertisement
In each case talked above, advertising has been among the most important sources of revenue during a long time in most locations of the world.
But currently the business of advertising is facing a variety of challenges and problems. Changes in the advertising industry practices has been slow. During the early '90s recession, advertisements were slumping. Especially given large shifts in TV technology, advertising and consumer lifestyles, advertisement is necessary to change.
Among major media, TV has no choice but to embrace change as well. It is the biggest advertising medium, accounting for more than $50 billion or about 23% of U.S. ad spending. TV revenue is booming, driven by strong demand from advertisers looking to spend to reach consumers looking to buy. But impending change is as clear as HDTV.
But how to change? Interactive TV came as the next big thing of the early '90s, but didn't attract enough eyes because the dot.com booming.