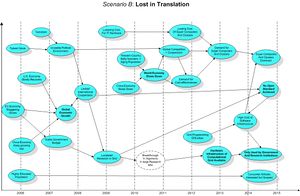
Causal-Effect Time Line B
Jump to navigation
Jump to search
This Causal-Effect Time Line Diagram aims to dipect:
- the events that happen
- the direction of the driving forces
which ultimately leads to Scenarios B, in which Grid has overcome its technical difficulties yet met obsticles in achieving worldwide adopted open standards, which causes it to fail the expectation of Commercial Sucess and stay as a high potential technology that is used mainly in Government and large research institutions.
