The Future of Maritime trade in 2020 and the implications for the port of Amsterdam
Team Members:
- Maria Marcos
- Mirjam Terhorst
- Andreas Schuil
- David Verberne
"Work under construction. In case you have any questions, additions or comments, please do not edit these pages, but you are more than welcome to contact us.'
Driving forces:
New Driving forces:
- Piracy
- Containerization
- Maritime Transportation security
- Consumer’s responsibility CO2 footprint
- Consumer/customer demands regarding speed of service/delivery
- Improvement through inventions
- Technical Innovation in the supply chain
- International Trade of goods
- The cost of freight shipping
- Building ‘green’
- Increase of Marine Pollution
Existing driving forces:
- Influence of the World Trade Organization (WTO)
- Increasing Use of e-Commerce
- Global Warming
- The increasing globalization of markets
Research Questions:
- How have shipping rates developed as per the recession?
- What’s the difference between deep sea and short-sea shipping?
- What are the current other (competing) methods of small vessel shipping transport (i.e. short-sea shipping)?
- What currency dominates what shipping market?
- What is the SEEMP?
- How is maritime trade developing over the last decades?
- What is the impact of containerization?
- What are the main ports in Europe?
- What are ship size developments?
- What are security issues in maritime trade?
- What is RFID?
- What is the trend of world imports and its forecast?
- What is the trend of world exports and its forecast?
- What is the trend of the industrial production of advance economies?
- What is the trend of the world consumer prices?
- What is TEU?
- What are the top European container ports?
- What are the top European liquid bulk ports?
- On what criteria is a port selected?
- What are the effects of the financial crisis on the world trade in 2009?
- What developments in Port performance can we observe?
- How does the Logistics supply chain look like?
- Environmental improvements in maritime shipping
Systems Diagram
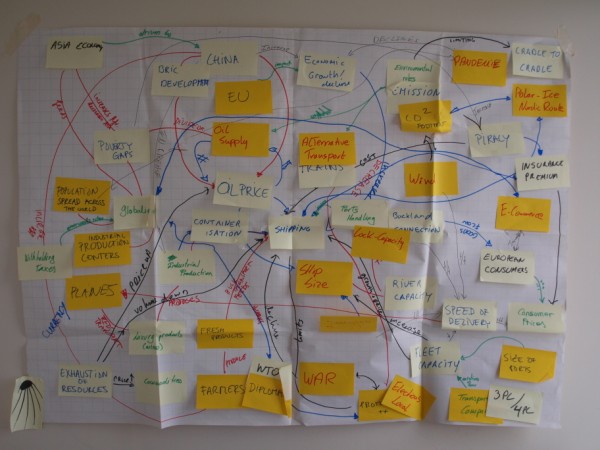
this is the result after some serious thinking in class and some non-serious braindump in a team meeting (many thanks to the "Old Dutch".
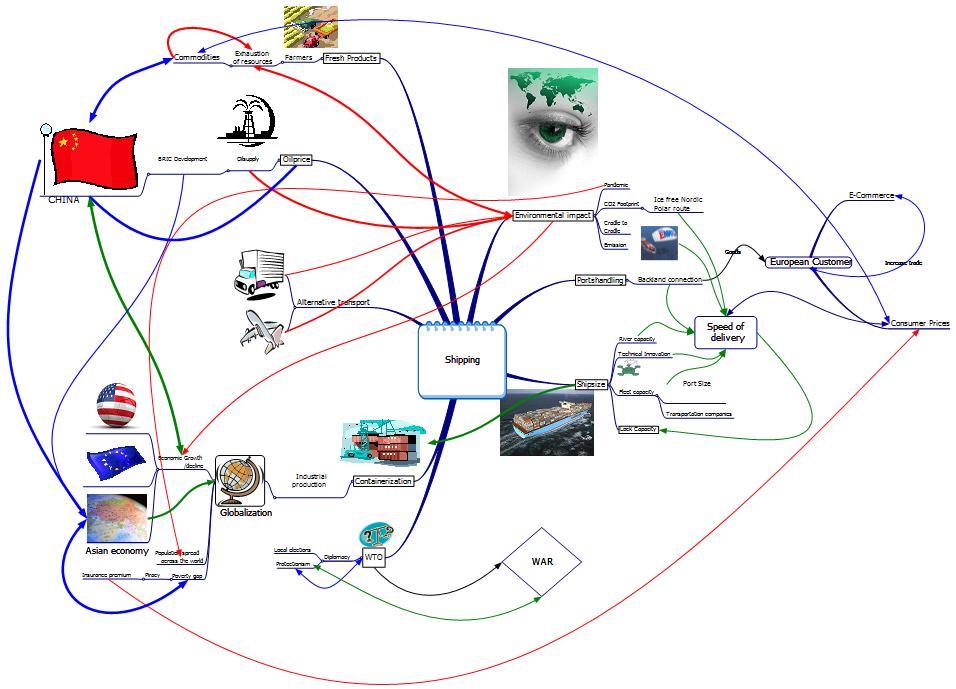
After processing the Post-it and lines chaos in some kind of mind mapping software, this is the result:
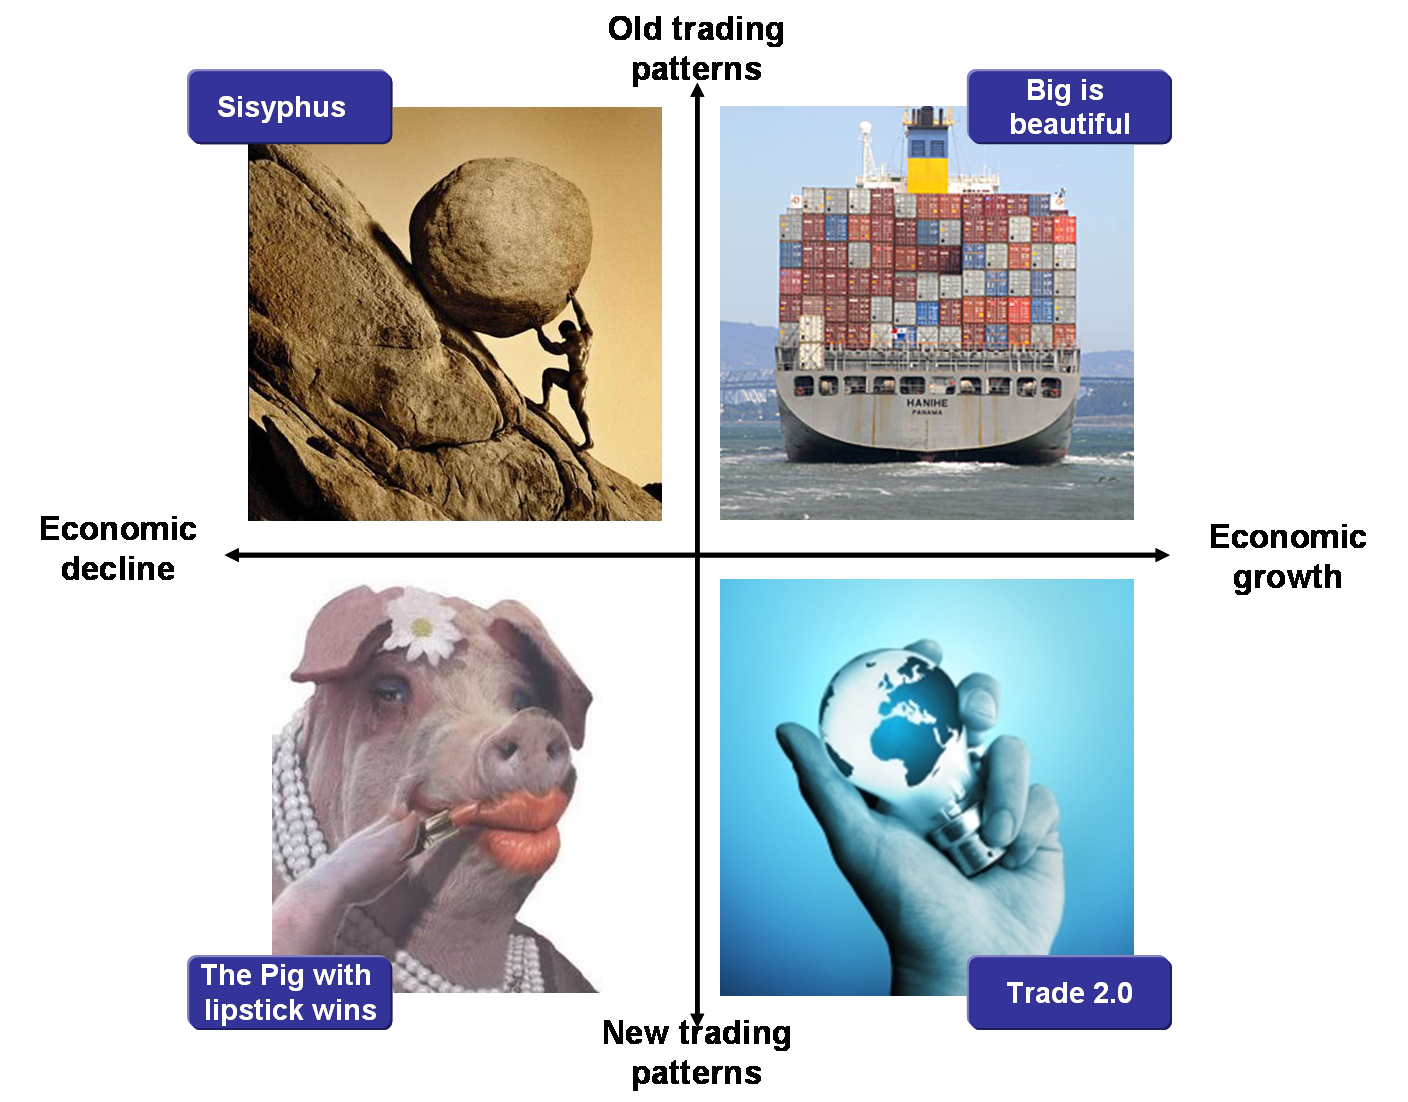
Scenario's graph
Scenario's stories
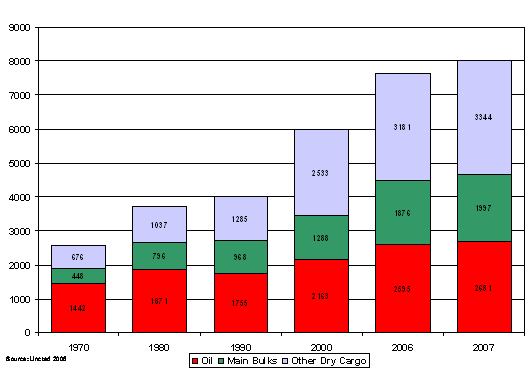
Due to globalization, maritime traffic has more than tripled over the last decades and is expected to continue growing. Growing demand from developed economies of North America, Europe and Japan leads to an increase in energy, container and mineral cargoes. Globalization leads to an international division of the production and consumption. Technical improvements in ship and maritime terminals facilitate the flows of freight. Economies of scale permit maritime transportation to remain a low cost mode, a trend which is strengthened by containerization.
Figure 1. Development of international seaborne trade, selected years (millions of tons)
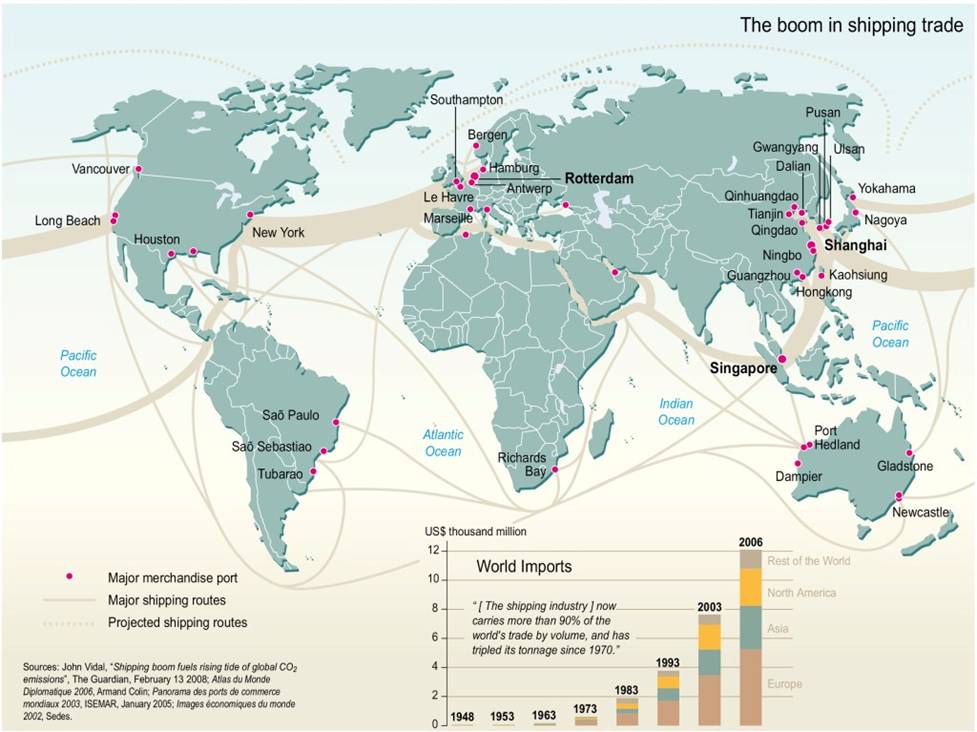
In 2007, world seaborne trade (goods loaded) increased by 4,8% to surpass 8 billion tons for the first time. World container port throughput grew by an estimated 11,7% to reach 485 million TEUs in 2007. Chinese ports accounted for about 28,4% of total world container port throughput. (source: Unctad, ‘Review of Maritime Transport 2008’). The world shipping trade map looked as follows:
After years of economic growth, the maritime trade had flourished. Major driving forces in the shipping industry had driven the maritime trade during new heights during the 1990s and the first decade of the new millennium. It was only the financial crisis of 2008 and 2009 that the shipping industry came grinding to a halt.
This is the starting point for our scenarios
